A scheduler’s primary function is to update the project progress with Primavera P6, with the method varying based on the project phase and type. Each engineer has their preferred approach, as the saying goes, “There is more than one way to skin a cat.” To streamline the update process, various tools such as visualization templates, Excel imports, predefined steps, and Primavera’s own tools can be utilized. The best method is the one that yields the most reliable results quickly.
In Primavera P6, understanding the different options for updating a schedule is crucial. There are three methods for calculating the actual progress of an activity: physical percentage completed, duration completed, and units completed.
1. Physical Progress
Physical progress is entered manually by the scheduler and is calculated externally from the schedule. This progress is based on two factors:
- Physical Parameter: If an activity has multiple resources assigned and progress needs to be reported based on one resource, the physical percentage must be used, and progress must be calculated manually.
- Expert Assessment: When there’s no objective way to measure progress, estimates are made. To aid in this, steps can be defined with corresponding progress percentages assigned to them.
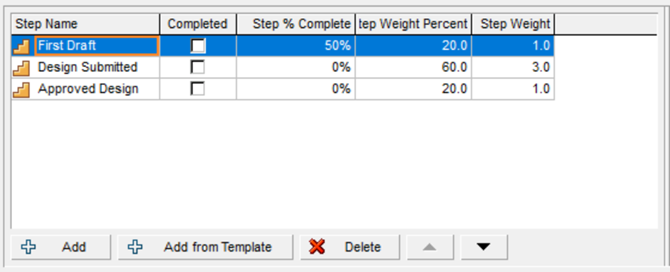
Steps
Primavera P6 allows defining activity steps and using them to update the physical percentage completed. Each step can have a weight and a progress percentage, or be marked as completed when reached. To calculate physical percentage using steps, activate the parameter “Activity percent complete based on activity steps” in the project’s calculations tab.
Physical Progress in WBS
WBS levels summarize the information of the activities they contain, such as man-hours or units, and the start date is the earliest date among all activities. However, physical percentage cannot be summarized at the WBS level since it is an external parameter.
Summary
Physical progress is a manual method based on expert judgment or external factors. It is useful when there are multiple resources assigned to an activity, but only one resource’s progress is needed. In this case, progress by units is not feasible as it includes all labor and non-labor resources assigned to the activity. A global change can be used to calculate and enter the value automatically.
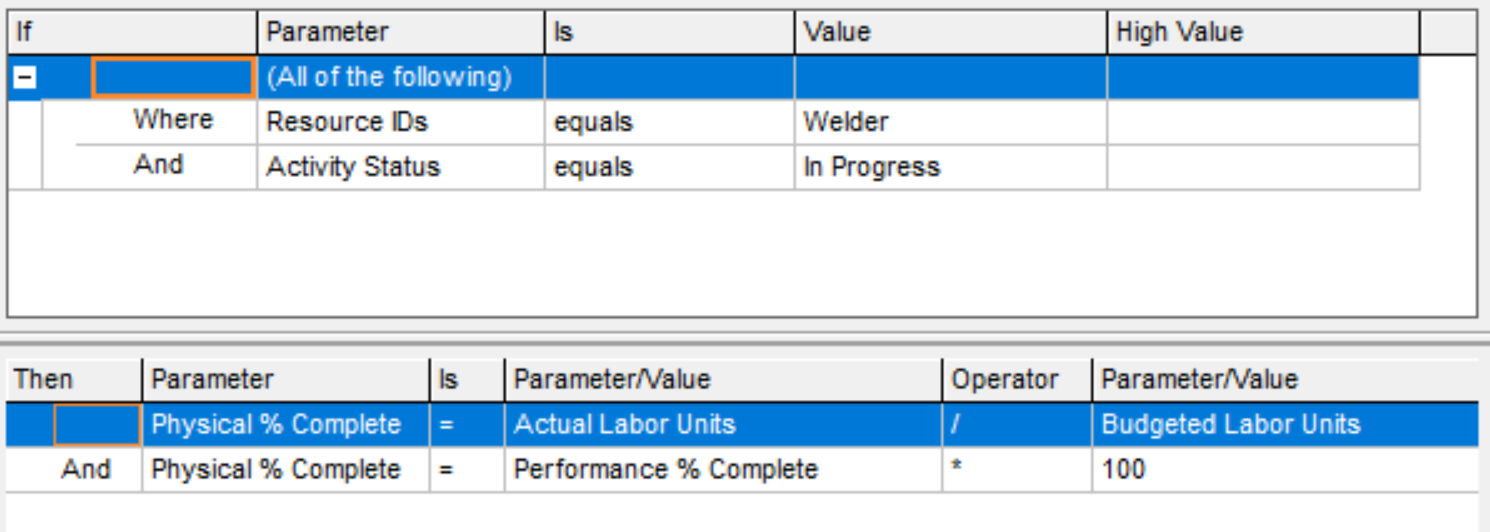
Additionally, if a duration percentage similar to Microsoft Project is needed, based on the Duration at Completion instead of the Original Duration, a global change can be created to calculate and present this value as a physical percentage complete.
2. Duration progress
The duration percentage complete indicates how much of the planned duration of an activity has been completed. For instance, if an activity is scheduled for 10 days and 2 days remain, the completion percentage is 80%. If an activity extends beyond the planned duration, the schedule adjusts the progress percentage, and the earned value is automatically recalculated based on the completed duration percentage.
The primary issue with Primavera P6’s calculation of duration percentage complete lies in its formula. Primavera P6 uses the original duration rather than the actual duration (at completion duration), leading to potentially misleading results.
Duration progress % = (Original Duration – Remaining Duration)/Original Duration
In contrast, Microsoft Project uses the actual duration, resulting in a different percentage:
Duration progress % (MSP) = Actual Duration/(Actual Duration + Remaining Duration)
Example:
Assume an activity with the following data:
- Original Duration: 10 days
- Actual Duration: 8 days
- Remaining Duration: 9 days
Duration progress % (P6) = (10-9)/10 = 10%
Duration progress % (MSP) = 8/(8+9) = 47%
Primavera P6 calculates the original duration as the difference between the early finish date and the early start date when the activity is not started. Once started, the original duration must be modified manually. To align with the Microsoft Project formula, a global change can be applied so that the original duration equals the duration at completion for all started activities. However, this approach is not recommended as it overwrites the original duration data and requires frequent global changes with each schedule update.
Duration progress in WBS
For WBS elements, the duration percentage complete is calculated similarly to individual activities:
Duration progress % (P6) = (“Original duration” – “Remaining duration” )/ “Original duration”
The WBS duration is based on the “Planned Start” and “Planned Finish” dates and the calendar assigned to the activities. If activities within a WBS have different calendars, Primavera uses the default calendar. This method is not recommended for tracking WBS progress due to the potential for storing unwanted dates and the inability to select specific calendars, leading to non-intuitive results.
Summary
The formula used by Primavera P6 for calculating duration percentage complete can be confusing for some planners. While it is possible to apply a global change to make the calculation more intuitive by modifying the original duration, this practice is not recommended. Using the duration percentage complete parameter for tracking project progress is generally not advisable due to its lack of intuitiveness and potential for causing confusion.
3. Units Progress
Primavera uses only the units (hours) associated with human (labor) and machinery (nonlabor) resources to calculate progress by units. The units of material resources (e.g., m2, m3, kg) are not considered. Unlike progress by duration, progress by units uses the total units, not the original units. The formula for calculating units percentage complete is:
[Units % Complete] = [Actual Units] / ([Actual Units] + [Remaining Units])
Actual units represent the sum of all actual units for human and machinery resources.
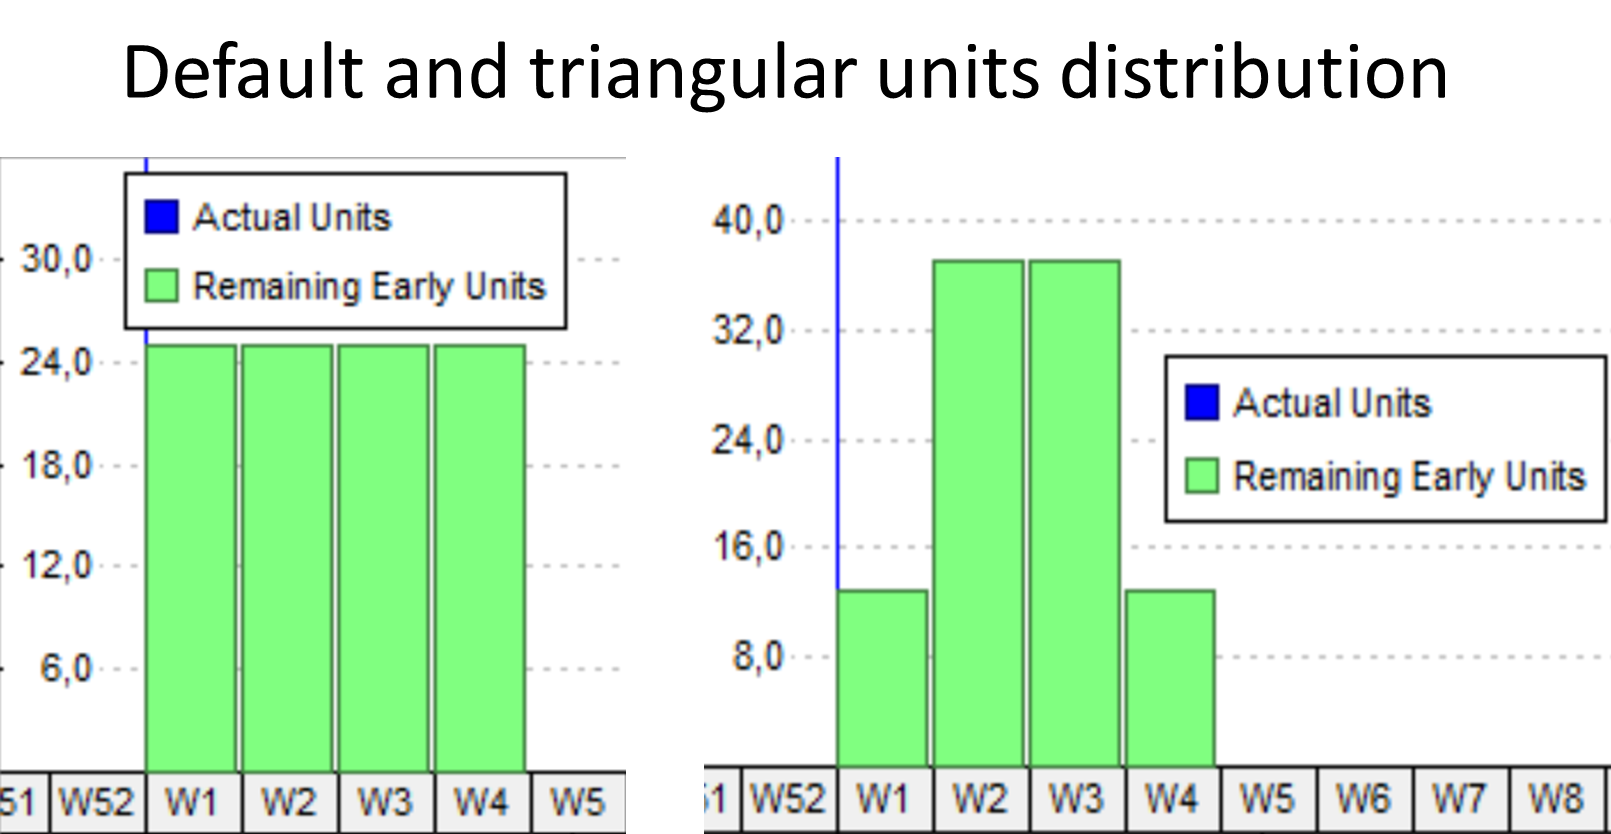
It is important to note that Primavera does not allow manual distribution of units for any resources. Primavera redistributes the actual units (whether man-hours, machinery hours, or materials) across the elapsed time. By default, this distribution is uniform, but various distribution curves can be used, or custom curves can be created.
However, there are limitations that often necessitate using Excel to maintain some records. For example, consider a flooring installation activity planned over 4 days to install 100 m2 of flooring. If 10 m2 are installed on the first day, nothing on the second day, 40 m2 on the third day, 20 m2 on the fourth day, and 30 m2 on the fifth day, tracking this in Excel would be straightforward. You’d create a table showing the square meters, hours, or other units installed each day for all necessary activities.
In Primavera, it’s not possible to assign actual units in this detailed manner directly. Instead, the 100 m2 of material units would be distributed according to the assigned resource curve. When using units to create progress curves, it is important to understand how Primavera handles activities with real units assigned. If an activity in progress has real units executed and the data date is moved forward, Primavera will redistribute those units across the elapsed days. This means that the past units will vary, thereby modifying past progress.
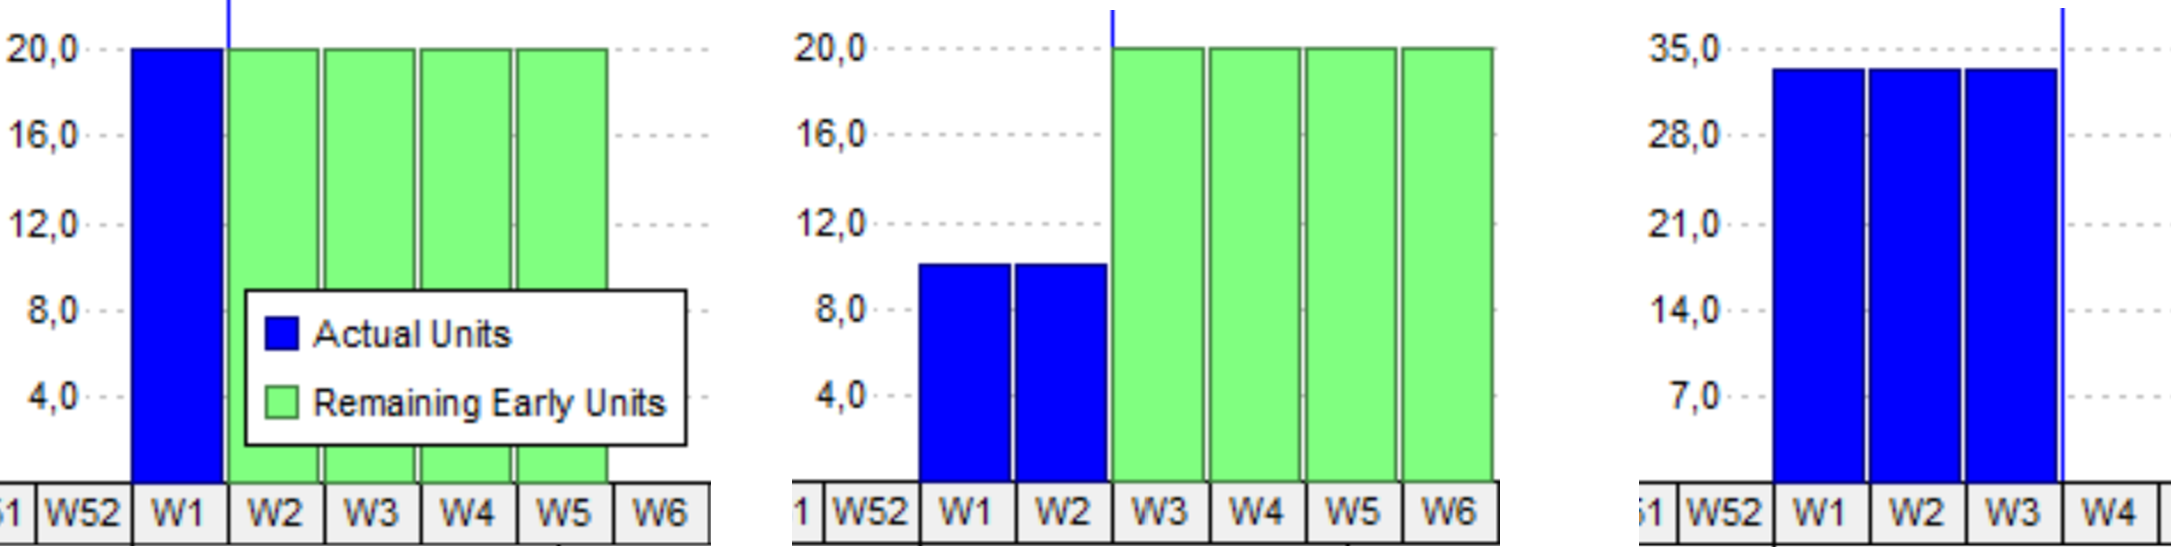
For example, in a project with a single activity requiring 100 units (whether material units, man-hours, or machinery), if 20 units are completed in the first week, the progress is 20%. If no work is done in the second week, and the data date is moved forward, Primavera will redistribute the 20 units over the two weeks according to the resource curve. With a uniform distribution, the progress would show 10% for each of the first two weeks. If the activity is completed in the third week, the progress curve would indicate 33.3% completion each week.
To solve this issue Primavera offers the option “Store period performance”. You can define a regular interval with the Financial period calendar and store the “Actual this period units” for every interval.
Units progress in WBS
For WBS elements, the percentage of progress by units is calculated similarly to individual activities. All actual units of human and machinery resources are summed and divided by the total units at completion (at completion units) of the assigned resources.
Summary
Progress by units is a simple and realistic way to monitor project progress as long as all activities have resources assigned and realistic information is available. The main challenges are obtaining the actual working hours for all activities and updating the remaining hours for all activities. Units can be exported and used to create progress curves, aiding in tracking and visualizing project progress effectively.