Description
One of the most common methods for managing disruption claims is through the application of the “measured mile analysis.” This methodology, compares the productivity achieved in areas or periods affected by disruptive events, with the productivity achieved in similar activities in periods not affected by those events.
Measured mile analysis seeks to establish the baseline of productivity for the contractor during periods unaffected by disruptions. Subsequently, this baseline is compared to productivity levels during disrupted periods to determine the extent of damage incurred.
It is essential to avoid comparing apples to oranges. For instance, assessing the productivity of cutting sheet metal versus welding the same material, would not provide a valid assessment due to the inherent differences between these tasks. Comparing tasks that share common characteristics in terms of complexity, resource utilization, and project context enhances the reliability and relevance of the analysis. This approach ensures that any disparities in productivity can be attributed to the specific conditions under examination rather than inherent dissimilarities in the nature of the tasks themselves.
Limitations
It is the most robust analysis, since it does not take into account planned productivity (budgeted units) but only uses the actual progress of the project. Nevertheless, this method has its limitations, which may render its application impractical in certain scenarios.
- Ensure an unaffected baseline: Identify an area or timeframe within the project that remains untouched by any external events or disruptions.
- Establish a substantial timeframe: Select a duration significant enough to provide a meaningful comparison between the unaffected baseline and the period affected by events.
- Ensure comparability of activities: The activities chosen for comparison should exhibit similarity in nature and scope, allowing for a meaningful assessment of the impact of external factors.
- Acquire contemporary, detailed, and reliable data: Gather accurate and up-to-date information that is both comprehensive and trustworthy, forming the foundation for a robust measured mile analysis.
For example, in a project where the offer and contract hinge on a geological study conducted by the owner and the contractor is tasked with the excavation of a trench. While the initial section aligns with the study results, the second segment unexpectedly contains substantial rock formations. Therefore, measured mile analysis could be applied to determine the contractor’s loss of productivity due to conditions not covered in the study conducted by the client.
This type of analysis is usually somewhat simpler and widely accepted in linear projects such as roads, railways, pipelines, cables or when the work is quite repetitive such as in earthworks.
It demands careful consideration as events may impact several activities differently and in different periods. At the same time, there are activities affected by various events whose responsibility is not always clearly defined. The application of measured mile analysis is impossible without reliable and detailed contemporary information.
The burden of proof typically falls on the party claiming, often the contractor, necessitating a clear demonstration of the causal link between events and project delays or performance loss. Consequently, the claiming party assumes the responsibility of generating and maintaining comprehensive information to substantiate their case.
Example
Initiating a disruption analysis involves pinpointing events or situations beyond the contractor’s responsibility that have adversely influenced the productivity of specific activities. Once these events and their impact on activities are identified, a thorough examination of the actual productivity of the work must be analyzed.
The following graph shows the accumulated progress of a given activity in blue and the productivity measured in percentage of progress per week in red. Productivity is calculated as the actual man hours used per unit of work (m3 excavated, linear meters installed, inches welded…). In this example, assuming a consistent weekly allocation of man-hours allows for a simplified calculation of progress differences over time.
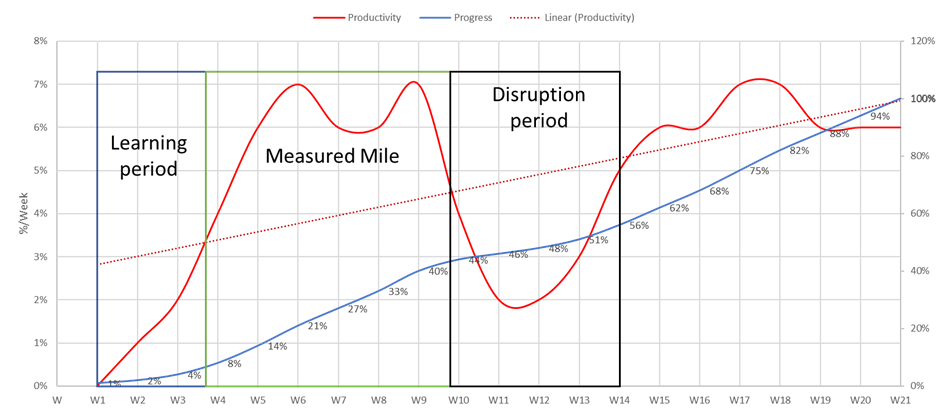
A low productivity rate serves as an indicator of increased costs in executing the work. This low productivity can be attributed to several reasons, so it must be analyzed in detail if the events identified were the cause of the decrease in productivity. This analytical approach facilitates the identification of time periods in which activities were likely affected by external events.
In this case, between week 10 and week 14, productivity fell below the trend line. Excluding the initial weeks of adaptation and learning, the average productivity of the period from weeks 4 to 10, not impacted by any event, is the measured mile. If events outside the contractor’s scope are identified as potential causes for the productivity decline, the difference between the average productivity established in the disruption-free period and the impacted period productivity becomes the basis for a valid claim.