Earned value analysis (EVA) is a technique that allows measuring the progress of a project against what was planned and budgeted. This involves assessing the completed work (earned value) against both the planned work (planned value) and the actual incurred costs (actual cost). Through this method, straightforward indicators are derived, enabling a determination of whether the project is adhering to its schedule and budget.
Earned Value Management (EVM) is a comprehensive project management approach that integrates scope, schedule, and cost analysis. It is based on the principles of Earned Value Analysis but encompasses a broader set of processes and practices. Earned Value Management provides a systematic methodology for planning, tracking and analyzing project progress, costs and performance.
Furthermore, Earned Value Analysis can be used prospectively to have a realistic forecast of project time and cost, or retrospectively to analyze the disruptions experienced up to date. To understand the earned value formulas, it is necessary to define the following concepts:
- Planned Value (PV): Approved budget to complete work by a given date.
- Earned Value (EV): Approved budget for work actually completed as of a given date.
- Actual costs (AC): Costs actually incurred to perform the work actually completed by a given date.
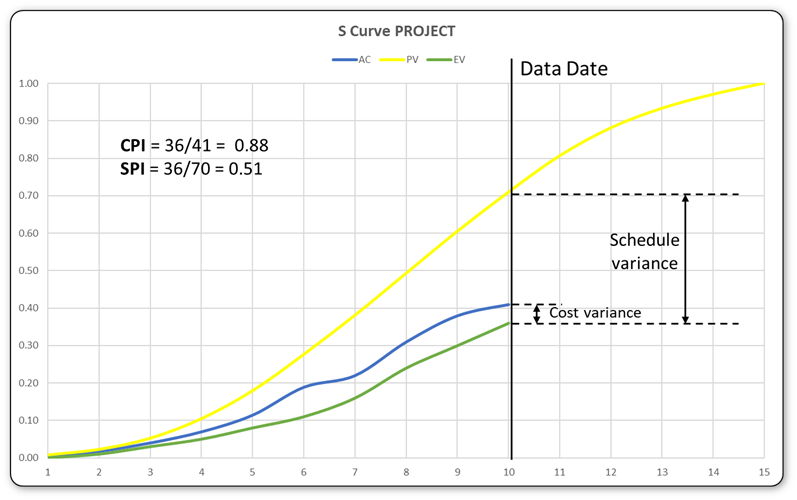
- Schedule Performance Index (SPI): Ratio between work actually completed (earned value – EV) and planned work (planned value – PV) as of a given date. It is a measure of the efficiency of the project in time. A value less than 1 indicates that the project is falling behind schedule.
SPI = EV/PV = % Actual progress * Budget / % Planned progress * Budget
- Cost Performance Index (CPI): Ratio between the budgeted cost for actual progress (earned value – EV) and the actual cost as of a given date. It is a measure of the cost efficiency of the project. A value less than 1 indicates that the project is spending more than planned.
CPI = EV/AC = % Actual progress * Budget / % Actual cost
In project management, these performance indicators are used to evaluate the health of the project.
Steps to calculate earned value:
- Quantify the work done or the progress achieved. In the case of an assembly line, the work done can be measured as the number of products completed. However, determining the progress of a construction project is not always easy. Depending on the type of project, the use of one form or another will be more appropriate.
- Obtain the total project budget.
- Apply the earned value formula. The earned value is equal to the work completed per estimate. This formula can be applied to the overall project or to the different packages individually. In the case of using planning software and having realistic data on the costs associated with each activity, the software can calculate the earned value accurately.
Example
Assuming a company that plans to produce 10 items a week. It is estimated that 12 hours are necessary for each item to produce those 10 items. The cost of direct labor is $20/h and $2,000 of consumables and materials per week. The indirect cost is $1,600 per week. Therefore, the average total cost per hour is $50/h, the cost of each item is $600, and the total cost is $6,000 per week.
Considering a 6-day work week, after 3 days of work, 5 items should be completed. Therefore, the planned value can be calculated as:
o Planned Value (PV) = % Planned Progress * Budget
o Planned value (PV) = 50% * 6000 = $3000
After 3 days of work, it is found that $3,600 (AC) has been spent but only 3 items have been manufactured. Therefore, the value gained is:
- Earned Value (EV) = % Actual Progress * Budget
- Earned Value (EV) = 30% * 6000 = $1800
- SPI = 30/50 = 0.6
- CPI = 1800/3600 = 0.5
If no measures are taken to recover the delay and reduce costs, according to the SPI, manufacturing 10 items will take 6/0.6 = 10 business days. According to the CPI, making 10 items will cost 6000/0.5 = $12000
Earned Value Analysis for disruption calculation
Disruption refers to a decrease in productivity caused by an unexpected event. In the context of a construction project, disruption occurs when the contractor performs work less efficiently than originally planned. Disruption analysis using earned value can be divided into several steps.
Information Collection:
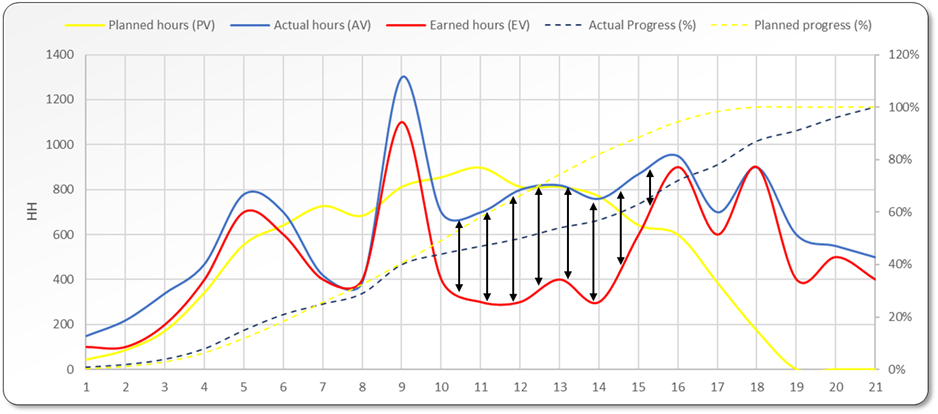
The first step is to collect all the relevant information about the period and activities to be analyzed. With the information obtained, the planned, actual, and earned work curve can be calculated. The planned work curve represents the man hours planned in the time to be analyzed. The actual curve represents the man hours spent in that period and the earned curve represents the theoretical man hours to achieve the progress achieved.
Curve Analysis:
The second step is to identify the periods where a disruption event is likely to have existed. These periods are characterized by showing a difference between the earned curve and the current one. The difference implies that the contractor has spent more hours than planned to achieve the same amount of work.
Event identification
The third step is to identify the events outside the contractor’s control that may have been the cause of the disruption in the periods with low productivity. If no event is identified, the claim is very unlikely to progress, since it is very likely that the disruption comes from low-skilled workers, a learning curve, material delays, lack of availability of machinery and tools or simply because the hours man’s plans were too optimistic. If disruptive events have taken place, to increase the probability of success, it is necessary to locate the notifications sent to the client in relation to these events.
Deviation assessment
The fourth step involves assessing the deviation between the actual and earned curves during periods marked by disruptive events. If such events impact time frames with minimal disparity between actual and earned hours, an inquiry into potential acceleration or recovery measures is essential. It becomes crucial to investigate whether these measures were influenced by unforeseen events, possibly hindering the desired outcomes.
In such instances, it is necessary to locate the relevant documentation supporting the measures and conduct an analysis to quantify the expected productivity enhancement, thereby calculating the consequences of the event.
Typically, the contractor claims that the effect of events occurring on the project is equal to the delta between the planned and actual total value. However, this could be interpreted as a global claim without any cause-and-effect argument.