In a construction project there are different types of costs, depending on the scope, type of project and its size. Some examples of the types of costs that must be faced are: Direct, indirect, fixed, variable, capital, maintenance, financing, design and environmental among others. For effective cost tracking and forecasting within a specific project, these costs can be classified into three main groups:
Direct Costs
- Definition: Expenses directly associated with the construction of the project.
- Components: Materials, labor, and specific equipment required for project execution.
- Dependency: Directly correlates with construction volume; independent of project deadline.
Indirect Costs
- Definition: Expenditures essential for project execution but not directly tied to a specific project component.
- Components: Administrative expenses, security, office rental, auxiliary machinery, personnel transportation, and indirect labor, among others.
- Dependency: Independent of construction volume; reliant on project deadline. Indirect costs typically represent 5% to 20% of the total project cost.
Fixed Costs
- Definition: Expenses unaffected by project volume or duration.
- Examples: Taxes, administrative fees, specific machinery, or equipment not included in direct or indirect costs.
- Dependency: Independent of construction volume and duration but dependent of the project type, industry, and country.
In addition to the mentioned costs, there are general expenses, occasionally considered indirect costs. General expenses represent the expenses associated with the overall operational functioning of the company during the project. These costs cannot be directly associated with the project but with the company operational functioning. Examples include general office expenses, marketing and representation costs, director expenses, or software licenses. These costs are usually between 1% and 5% of the total project budget depending on its relevance.
In summary, direct costs are those directly tied to the work unit, while indirect costs are vital for sustaining the project or company operations. Cost estimation, a critical phase during tendering, involves leveraging level 3 project planning to assess direct costs. This entails loading man-hours, materials, and machinery requirements for each activity, often specified in project offers.
The calculation of indirect costs may vary depending on the nature and complexity of the project. While the most accurate method involves summing up individual items constituting indirect costs, this approach can be excessively intricate. Hence, it is commonplace to apply a percentage to the direct costs, a method whose applicability varies depending on the sector and the specific company.
Once all the planned costs have been calculated and divided into one of the 3 previous categories, they can be added to the detailed planning. Direct costs must be included as material resources, machinery and labor for each of the planning activities. These resources will have an associated cost per unit or hour so that once assigned, the total direct cost can be calculated.
Indirect costs are related to the period in which the project is developed, so the cost per time unit can be calculated. To ensure that the indirect costs vary according to the end date, a resource can be assigned to an activity type “WBS Summary” with “Duration type” = “Fixed Duration and Units/Time”. Depending on how many indirect resources and how many activities are created, very detailed control of the indirect cost of the project can be carried out.
In addition to resource allocation, Primavera P6 offers the functionality to establish distinct fixed expenses for each activity. All fixed costs must be recorded through the “Expenses” tab, necessitating comprehensive data input. In some cases, instead of resources, it is possible to use this option to control all costs in a simplified way.
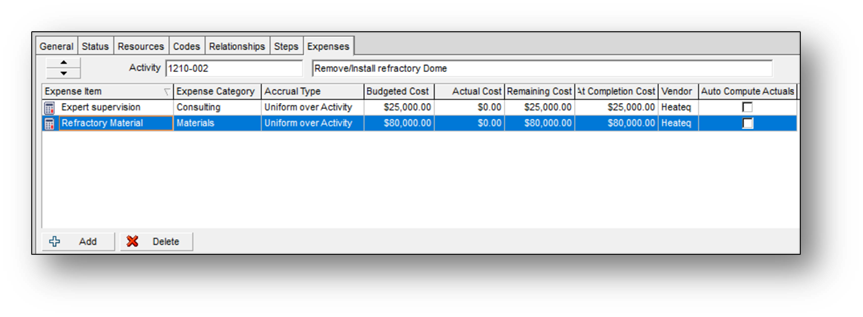
For costs to be counted automatically, the “Auto compute Actuals” option must be activated.
Example indirect costs in Primavera P6
Assuming a project whose indirect costs have been divided into:
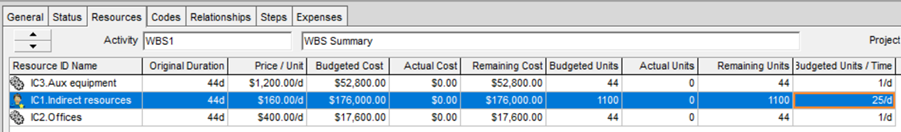
- IC1. Indirect resources: Average daily cost of each indirect resource.
- IC2. Offices: Cost of office rental, electricity, and office consumables.
- IC3. Aux equipment: Cost of rental and fuel for portable lights and construction car.
The project is planned to be completed in 44 days with a cost of $1,200 per day in auxiliary equipment, $400 in the offices and with 25 people of indirect labor ($160/day). The total planned indirect costs are $246,400. These indirect costs must be assigned to a “WBS Summary” activity so that, if the project is prolonged, the duration of the activity and therefore the costs (units) also increase.
After 12 days, various delays have arisen that have caused the project to be delayed by 29 days. Moreover, there has been an increase in the number of indirect personnel from the initially planned 25 to a current count of 30. Additionally, the daily cost for office facilities is $30 per day more than planned.
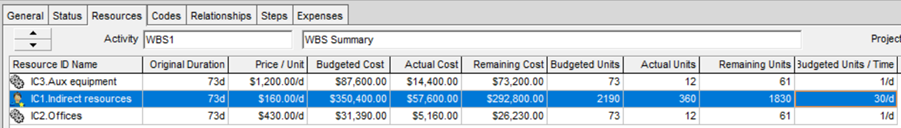
Once the changes have been made to the planning, we must recalculate the dates (F9) and the costs (Tools > Recalculate Assignment Costs). The total planned indirect costs are now $459,390. You can work with hours as a temporal unit, but you need to be careful with the assigned calendar.
Earned value in Primavera P6
Earned value analysis (EVA) is a technique that allows measuring the progress of a project against what was planned and budgeted. This method involves evaluating the accomplished work (earned value) in contrast to both the projected work (planned value) and the actual costs incurred. By juxtaposing these key metrics, EVA provides straightforward indicators to determine whether the project is on time and within budget.
To calculate the earned value with Primavera P6, it is necessary to follow the following steps:
- Load costs on the project baseline with resources that do not automatically calculate actual values (Auto compute Actuals).
- Assign the baseline for the calculation of earned value.
- Check that all activities have the “Physical” progress type.
- Define the settings for the calculation of earned value Admin>Admin Preferences>Earned value.
- Update progress activities and costs and recalculate the project.

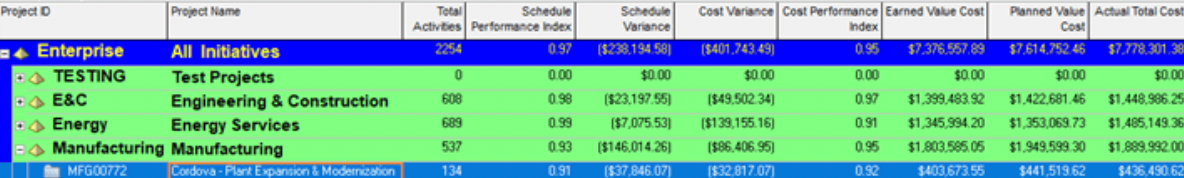
Primavera P6 is not only a project planning tool but also allows project portfolio management. Earned value data for all projects can be viewed and analyzed from the projects menu by activating the specific columns of the indices to be evaluated.
Budget control and project expenses
Managing a project’s budget and expenses typically falls under the responsibility of the project manager in collaboration with the cost control team. While there are specialized software solutions designed for precise and detailed cost control, one often overlooked, yet beneficial option, is leveraging Primavera P6. Despite its reputation for complexity, this tool offers project management teams and area directors an option for straightforward control and a comprehensive and global overview of one or more projects.
Despite being easy to use, this option is one of the least used. It is not common to find a Project manager with knowledge or initiative to learn how to use Primavera P6, due to the reputation of being a complicated and unintuitive software. It should be noted that the Primavera P6 budget and expense control tool uses a tiered approach. This means that a total budget or expense at the top node needs to be distributed to the corresponding lower nodes, applying this principle from the highest level of Enterprise Project Structure (EPS) down to the lowest Work Breakdown Structure (WBS) level for each project.
In the planning stage, the Project manager and responsible parties must estimate the budget for each scope (WBS) or project/department (EPS). Primavera P6 simplifies the process of setting and tracking budgets for each work structure (WBS) within each project and for each enterprise structure (EPS).
The Spending Plan feature in Primavera P6 is particularly valuable for easily monitoring actual costs against the assigned budget. The spending plan spans from 3 months before the project’s initiation to 4 years after its conclusion. Various fields are utilized for the expense plan, including:
1) Spending Plan: This field entered by the user, represents the budget assigned for the EPS/Project/WBS.
2) Spending Plan Tally: This field compiles data from lower or child nodes, representing the accumulated spending.
3) Undistributed Current Variance: This field indicates whether the budget has been distributed to the child nodes (WBS/EPS) or not (Spending Plan – Spending Plan Tally).
4) Benefits: The Benefit Plan, Benefit Plan Count, and Benefit Variance follow a parallel logic to Spending Plan, Spending Plan Tally, and Undistributed Current Variance.
Example
For this example, the initial budget (Original Budget) encompasses the total contract value, including indirect costs and profit. The Spending Plan outlines the planned monthly costs. The Spending Plan Tally reflects the actual spending each month. Consequently, the Undistributed Current Variance quantifies the variance between the planned and actual expenditures.
It’s essential to note that the interpretation of entered values may vary based on objectives or work methodologies. For instance, the initial budget might exclude benefits, and the spending plan could be updated with actual spending once the data is available.
Budget Log
Assuming an initial budget of $2.5 million for a specific project, on September 17, an approved contract addendum expanded the scope, deadline, and budget by $500,000. This adjustment resulted in a total budget of $3 million (applicable to EPS, project, or WBS).

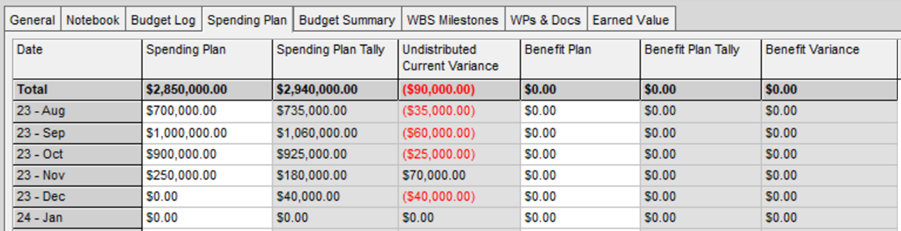
Spending Plan
The work began in August, with a total planned expenditure of 2.85 million distributed over the 4 months that the project is planned to last. In the lower nodes, specifically within the project’s Work Breakdown Structure (WBS), the actual expenses for each month have been added Consequently, the Spending Plan Tally offers a consolidated view, illustrating the cumulative expenses across all WBS elements at the initial tier.
To provide a succinct evaluation, the Undistributed Current Variance column shows the variance between the spending plan and the actual cumulative expenses (Spending Plan Tally). Negative variances are visually highlighted in red, offering a quick and intuitive insight into areas where the actual spending surpasses the originally allocated budget.
Budget Summary
This tab displays a summary of all previously entered data. In the first section is the Budget of the project and how much has been distributed in the lower nodes. The second section shows the difference between the Spending Plan and the budget. Finally, the accumulated spending plan and the distributed and non-distributed part of the lower node are shown. In this example, negative $90,000 would remain undistributed, which, according to the previous definition of concepts for this example, represents an increase in actual expenses compared to what was planned.
